Note
Access to this page requires authorization. You can try signing in or changing directories.
Access to this page requires authorization. You can try changing directories.
When you're running a web application, you want to be prepared for any problems that might arise. Such problems can range from HTTP 500 errors to your users telling you that your site is down. Azure App Service diagnostics is an interactive experience to help you troubleshoot your app with no configuration required. If you have problems with your app, App Service diagnostics points out what's wrong and guides you to the right information to more easily and quickly troubleshoot and resolve the problem.
Although this experience is most helpful when you're having problems with your app within the last 24 hours, all the diagnostic graphs are always available for you to analyze.
App Service diagnostics works for not only apps on Windows, but also apps on built-in or custom containers, App Service Environments, and Azure Functions.
Steps for opening App Service diagnostics
To access App Service diagnostics:
- In the Azure portal, go to your App Service web app or your App Service Environment.
- On the left menu, select Diagnose and solve problems.
The App Service diagnostics page provides many tools to diagnose app problems. For more information, see Diagnostic tools later in this article.

Note
If your app is down or performing slowly, you can collect a profiling trace to identify the root cause of the problem. Profiling is lightweight and is designed for production scenarios.
Diagnostic interface
The page for App Service diagnostics offers streamlined diagnostic access in multiple sections.
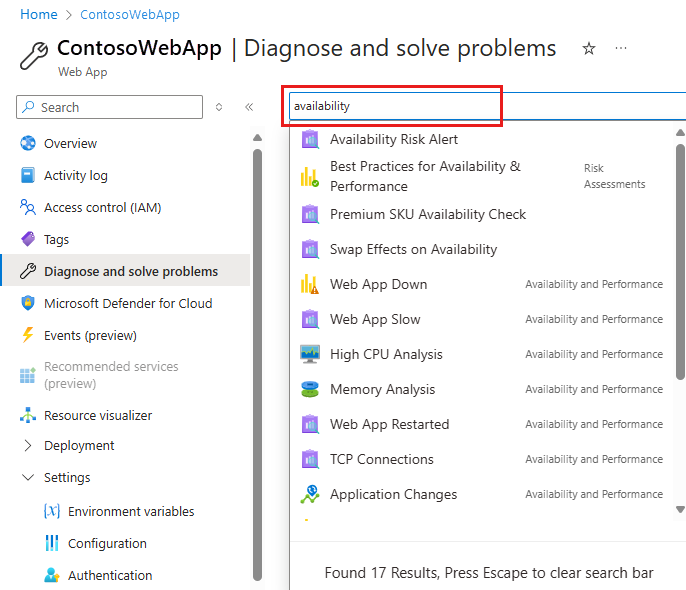
Search box
The search box is a quick way to find a diagnostic. You can find the same diagnostic through troubleshooting categories.
Risk alerts
The App Service diagnostics page performs a series of configuration checks and offers recommendations based on your application's unique configuration.
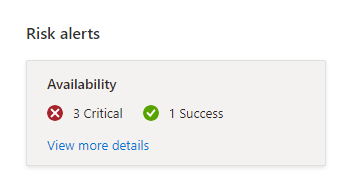
To review recommendations and performed checks, select the View more details link. The information appears in a panel on the right side of the window.

Troubleshooting categories
Troubleshooting categories group diagnostics for ease of discovery. The following categories are available:
- Availability and Performance
- Configuration and Management
- SSL and Domains
- Risk Assessments
- Deployment
- Networking
- Navigator (Preview)
- Diagnostic Tools
- Load Test your App
The tiles or the Troubleshoot link shows the available diagnostics for the category. If you're interested in investigating availability and performance, the following diagnostics are available on the left menu:
- Overview
- Web App Down
- Web App Slow
- High CPU Analysis
- Memory Analysis
- Web App Restarted
- TCP Connections
- Application Changes
- Application Crashes
- Child Process Crashes
- HTTP 4xx Errors
- SNAT Port Exhaustion
- Testing in Production
- WebJob Details
Diagnostic report
To investigate the problem further, you can select a topic and view more details in a diagnostic report. These details are often supplemented with graphs and Markdown.
The diagnostic report can be a powerful tool for pinpointing the problem with your app. The following example is the Web App Down report in Availability and Performance.

Investigation of application code problems (only for Windows apps)
Because many app problems are related to application code, App Service diagnostics integrates with Application Insights to highlight exceptions and dependency issues to correlate with the selected downtime. You enable Application Insights separately.
To view Application Insights exceptions and dependencies, select the Web App Down or Web App Slow tile shortcut.
Troubleshooting steps
If a problem is detected in a specific category within the last 24 hours, you can view the full diagnostic report. App Service diagnostics might prompt you to view more troubleshooting advice and next steps for a more guided experience.

Diagnostic tools
App Service includes advanced diagnostic tools that help you investigate application code issues, slowness, connection strings, and more. It also includes proactive tools that help you mitigate problems with CPU usage, requests, and memory.
Proactive CPU monitoring (only for Windows apps)
Proactive CPU monitoring helps you take action when your app or a child process for your app is consuming high CPU resources. You can set your own CPU threshold rules to temporarily mitigate unexpectedly high CPU until the real cause is found. For more information, see the blog post Mitigate your CPU problems before they happen.
Auto-healing
Auto-healing is a mitigation action that you can take when your app has unexpected behavior. You can set your own rules based on request count, slow request, memory limit, and HTTP status code to trigger mitigation actions. Use the tool to temporarily mitigate an unexpected behavior until you find the root cause.
The tool is currently available for Windows web apps, Linux web apps, and Linux custom containers. Supported conditions and mitigation vary, depending on the type of the web app. For more information, see the blog posts Announcing the New Auto Healing Experience in App Service Diagnostics and Announcing Auto Heal for Linux.
Proactive auto-healing (only for Windows apps)
Like proactive CPU monitoring, proactive auto-healing is a turnkey solution for mitigating unexpected behavior in your app. Proactive auto-healing restarts your app when App Service determines that your app is in an unrecoverable state. For more information, see the blog post Introducing Proactive Auto Heal.
Navigator (only for Windows apps)
In a large team with continuous integration and where your app has many dependencies, it can be difficult to pinpoint the specific change that causes an unhealthy behavior. Navigator helps get visibility on your app's topology by automatically rendering a dependency map of your app and all the resources in the same subscription.
Navigator lets you view a consolidated list of changes that your app and its dependencies made. You can then narrow down on a change that's causing unhealthy behavior. You access the feature through the Navigator tile on the page for App Service diagnostics. Before you can use the feature, you need to enable it. For more information, see the blog post Get visibility into your app's dependencies with Navigator.
Change analysis
You can access change analysis for app changes through the tile shortcuts Application Changes and Application Crashes in Availability and Performance. You can use change analysis concurrently with other metrics. Before you use the feature, you must enable it. For more information, see the blog post Announcing the new change analysis experience in App Service Diagnostics.
Questions or feedback
Post your questions or feedback at UserVoice by adding [Diag] in the title.