Note
Access to this page requires authorization. You can try signing in or changing directories.
Access to this page requires authorization. You can try changing directories.
Important
Items marked (preview) in this article are currently in public preview. This preview is provided without a service-level agreement, and we don't recommend it for production workloads. Certain features might not be supported or might have constrained capabilities. For more information, see Supplemental Terms of Use for Microsoft Azure Previews.
In this article, you learn to streamline your model selection process in the Azure AI Foundry model catalog by comparing models in the model leaderboards (preview) available in Azure AI Foundry portal. This comparison can help you make informed decisions about which models meet the requirements for your particular use case or application. You can compare models by viewing the following leaderboards:
- Quality, cost, and performance leaderboards to quickly identify the model leaders along a single metric (quality, cost, or throughput);
- Trade-off charts to see how models perform on one metric versus another, such as quality versus cost;
- Leaderboards by scenario to find the best leaderboards that suite your scenario.
Prerequisites
An Azure subscription with a valid payment method. Free or trial Azure subscriptions won't work. If you don't have an Azure subscription, create a paid Azure account to begin.
Access model leaderboards
- Sign in to Azure AI Foundry.
- If you’re not already in your project, select it.
- Select Model catalog from the left pane.
Go to the Model leaderboards section of the model catalog. This section displays the top three model leaders ranked along quality, cost, and performance. You can select any of these models to check out more details.

From the Model leaderboards section of the model catalog, select Browse leaderboards to go to the model leaderboards landing page to see the full suite of leaderboards that are available.

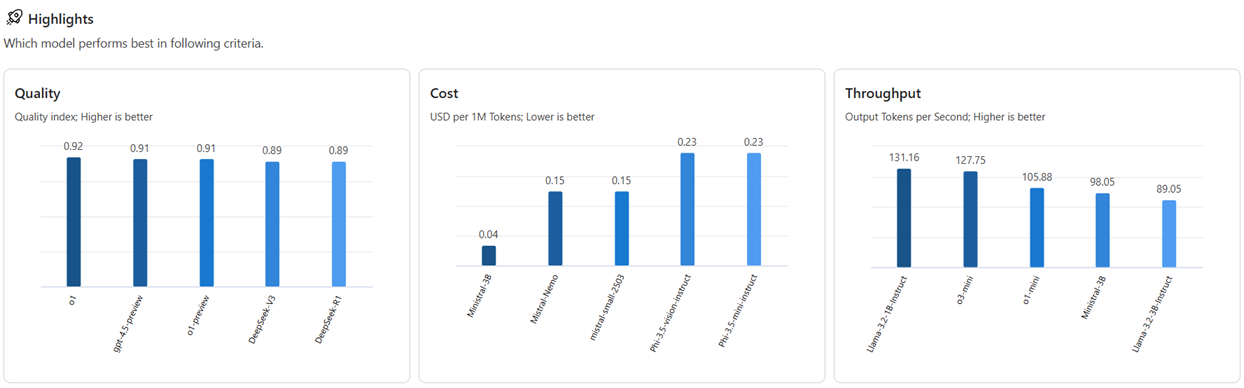
The homepage displays leaderboard highlights for model selection criteria. Quality is the most common criterion for model selection, followed by cost and performance.


Compare models in the trade-off charts
Trade-off charts allow you to compare models based on the criteria that you care more about. Suppose you care more about cost than quality and you discover that the highest quality model isn't the cheapest model, you might need to make trade-offs among quality, cost, and performance criteria. In the trade-off charts, you can compare how models perform along two metrics at a glance.
- Select the Models selected dropdown menu to add or remove models from the trade-off chart.
- Select the Quality vs. Throughput tab and the Throughput vs Cost tab to view those charts for your selected models.
- Select Compare between metrics to access more detailed results for each model.

View leaderboards by scenario
Suppose you have a scenario that requires certain model capabilities. For example, say you're building a question-and-answering chatbot that requires good question-and-answering and reasoning capabilities. You might find it useful to compare models in these leaderboards that are backed by capability-specific benchmarks.

Once you've explored the leaderboards, you can decide on a model to use.
View benchmarks from the model card
Select a model to your liking and select Model details. You can select the model from one of the displayed leaderboards, such as the quality leaderboard at the top of the model leaderboards homepage. For this example, select gpt-4o. This action opens the model's overview page.
Go to the Benchmarks tab to check the benchmark results for the model.

Select Compare with more models.
Switch to the List view to access more detailed results for each model.


Analyze benchmark results
When you're in the "Benchmarks" tab for a specific model, you can gather extensive information to better understand and interpret the benchmark results, including:
High-level aggregate scores: These scores for AI quality, cost, latency, and throughput provide a quick overview of the model's performance.
Comparative charts: These charts display the model's relative position compared to related models.
Metric comparison table: This table presents detailed results for each metric.


By default, Azure AI Foundry displays an average index across various metrics and datasets to provide a high-level overview of model performance.
To access benchmark results for a specific metric and dataset:
Select the expand button on the chart. The pop-up comparison chart reveals detailed information and offers greater flexibility for comparison.

Select the metric of interest and choose different datasets, based on your specific scenario. For more detailed definitions of the metrics and descriptions of the public datasets used to calculate results, select Read more.


Evaluate benchmark results with your data
The previous sections showed the benchmark results calculated by Microsoft, using public datasets. However, you can try to regenerate the same set of metrics with your data.
Return to the Benchmarks tab in the model card.
Select Try with your own data to evaluate the model with your data. Evaluation on your data helps you see how the model performs in your particular scenarios.

